Pharmacist Salary in Delaware: $151,749 (2026)
Quick Answer:Across Delaware's 6 metropolitan areas, the average median pharmacist pay sits at $151,749/year heading into 2026 — a figure projected from 2025 BLS OEWS wage data for SOC 29-1051. Because Delaware sits at BEA RPP 101.7 (2% above the U.S. baseline), that statewide median translates to roughly $149,212 in nationally-comparable purchasing power. Highest-paying metros: Dover ($151,930), Wilmington ($151,280), Newark ($142,381).
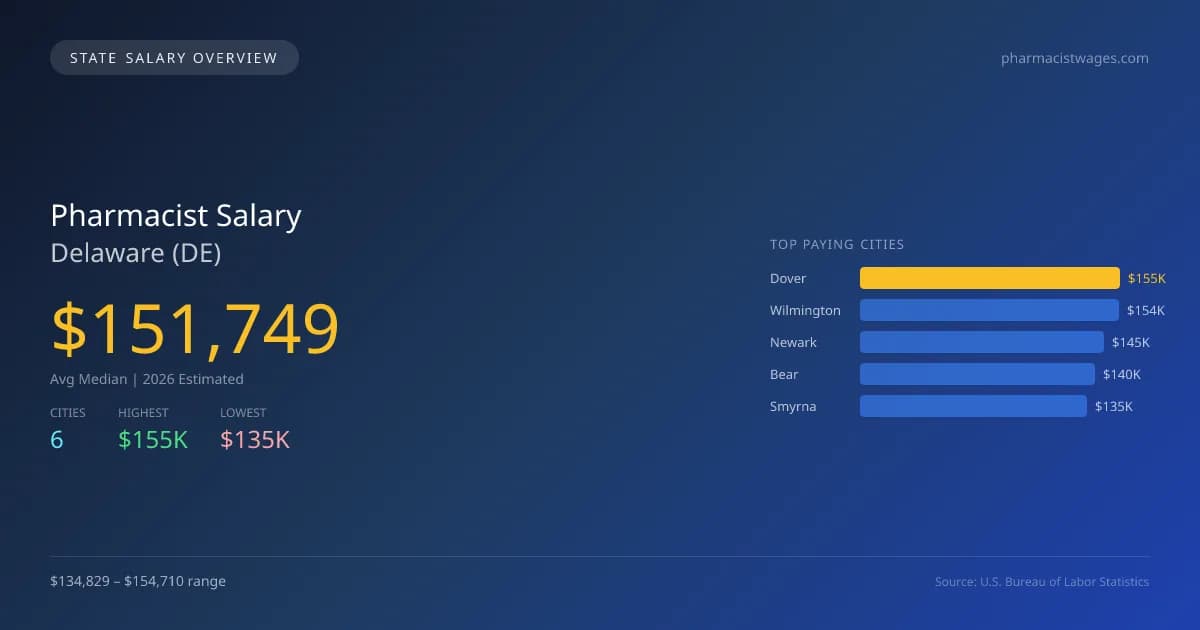
In 2026, pharmacists in Delaware can expect an average median salary of $151,749, which aligns favorably with the national median of $143,489, representing a 5.8% increase. Dover offers the highest salary at $154,710, while Middletown has the lowest at $134,829, marking a salary gap of $19,881 between the two cities. This disparity can be attributed to factors such as local cost of living, demand for healthcare services, and the concentration of hospitals and pharmacies. Delaware's pharmacy professional environment is shaped by specific state licensing requirements and scope of practice laws that allow pharmacists to perform various clinical tasks, contributing to their value in the healthcare system. The projected annual compound growth rate for pharmacist employment is 1.83%, indicating steady job market strength. With a total of 122 employed pharmacists and cities like Wilmington and Newark also offering competitive salaries—$154,048 and $144,987 respectively—pharmacists are well-positioned in the state. Demand drivers such as the aging population and an emphasis on healthcare access further bolster job security in this profession. Overall, Delaware presents a favorable landscape for pharmacists looking to establish or advance their careers.
Delaware Pharmacist Salary Range
Overall salary range in Delaware: $86,423 (lowest entry-level) to $188,111 (highest top earner)
Delaware vs National Average
Delaware pharmacists earn 5.76% more than the national median (+$8,260/year difference).
Delaware Pharmacist Salary Distribution (2026)
Pharmacist salaries in Delaware range from $91,142 (entry-level, 10th percentile) to $182,672 (top earners, 90th percentile), with a median of $151,749. The Delaware median is $8,260 above the US national median of $143,489. The average hourly rate is $72.96/hr. Approximately 122 pharmacists are employed across 6 cities.
2019 BLS Actual
$141,180
2025 BLS Actual
$149,022
2026 Current Est.
$151,749
2019–2027 Growth
+9.5%
Salary Trajectory for Pharmacists in Delaware (2019–2027)
2019–2025: actual BLS OEWS data for this metro area. 2026+: CAGR 1.83% projection.
| Year | Annual Salary | Status |
|---|---|---|
| 2019 | $141,180 | Actual |
| 2020 | $138,660 | Actual |
| 2021 | $127,050 | Actual |
| 2022 | $129,730 | Actual |
| 2023 | $135,210 | Actual |
| 2024 | $132,686 | Actual |
| 2025 | $149,022 | Actual |
| 2026(current) | $151,749 | Estimated |
| 2027 | $154,526 | Projected |
Based on 7 years of BLS OEWS data for the Delaware metropolitan area, the median pharmacist salary grew 5.6% from $141,180 (2019) to $149,022 (2025). At a 1.83% compound annual growth rate, salaries are projected to reach $154,526 by 2027 — a total increase of $13,346 (9.45%) from 2019.
Note: Historical values (2019–2025) are actual BLS OEWS figures for the Delaware metropolitan area, sourced from annual Occupational Employment and Wage Statistics surveys. 2026–2026 figures are current estimates, and 2027 values are projections, calculated using a 1.83% CAGR derived from 7-year BLS historical data. Actual salaries may vary based on employer, experience, certifications, and local market conditions.
Top 5 Highest Paying Cities in Delaware
Lowest Paying Cities in Delaware
| City | Median Salary |
|---|---|
| Middletown | $134,829 |
| Smyrna | $135,192 |
| Bear | $139,844 |
| Newark | $144,987 |
| Wilmington | $154,048 |
Best Value Cities for Pharmacists in Delaware
When adjusted for local cost of living, these Delaware cities offer the most purchasing power for pharmacists.
| City | Nominal Salary | CoL Index | Adjusted Salary |
|---|---|---|---|
| Dover | $154,710 | 97.507 | $158,666 |
| Wilmington | $154,048 | 101.7 | $151,473 |
| Newark | $144,987 | 101.7 | $142,563 |
| Bear | $139,844 | 101.7 | $137,506 |
| Smyrna | $135,192 | 101.7 | $132,932 |
Adjusted salary = nominal salary × (100 / CoL index). CoL index: 100 = national average. Lower index = lower cost of living.
Salary by Experience Level in Delaware
| Experience Level | Estimated Annual |
|---|---|
| Entry Level (0-2 years) | $91,142 |
| Mid Career (3-7 years) | $151,749 |
| Experienced (7+ years) | $182,672 |
Estimates based on BLS percentile data averaged across Delaware metro areas. Individual pay varies by employer, certifications, and specialization.
All 6 Cities in Delaware
| # | City | Median Salary |
|---|---|---|
| 1 | Dover | $154,710 |
| 2 | Wilmington | $154,048 |
| 3 | Newark | $144,987 |
| 4 | Bear | $139,844 |
| 5 | Smyrna | $135,192 |
| 6 | Middletown | $134,829 |
More Delaware Salary Data
Explore More Pharmacist Salary Data
Frequently Asked Questions
How much do pharmacists make in Delaware in 2026?
What is the highest paying city for pharmacists in Delaware?
How does Delaware pharmacist pay compare to the national average?
What is the entry-level pharmacist salary in Delaware?
How many pharmacists are employed in Delaware?
Which Delaware city offers the best value for pharmacists?
Written by Sofia Chen, PharmD
Career Analyst
Sofia Chen has 10 years of experience in community pharmacy. She specializes in medication therapy management.
Methodology & Data Source
Statewide salary figures on this page are 2026 projections based on the Bureau of Labor Statistics Occupational Employment and Wage Statistics (OEWS) survey, May 2026 release. A 1.83% compound annual growth rate (CAGR), derived from 6-year national BLS wage trends, was applied to each metro area's reported salary to estimate current 2026 pharmacist compensation across Delaware. State averages are employment-weighted across 6 metro areas — larger metro areas with more pharmacistscontribute proportionally more to the average, producing figures that better reflect typical compensation. Individual pay varies by city, employer, certifications, and experience.
Data Sources & Methodology
Source: BLS, OEWS, 7-year dataset (–). Per-city data from annual BLS metropolitan area surveys.
2026 figures are projected from 2025 BLS data using a compound annual growth rate (CAGR) of 1.83%, derived from historical BLS wage trends for pharmacists (SOC 29-1051).
Compiled and verified by Sofia Chen, PharmD, a licensed pharmacist with 10+ years of clinical experience. · View source data at BLS.gov