Pharmacist Salary in Norfolk, NE: $122,274 (2026)
Quick Answer:A full-time pharmacist in Norfolk, NE earns a median $122,274/year (≈ $58.79/hour) in nominal terms for 2026 — projected from BLS OEWS 2025 (SOC 29-1051). Once you factor in Norfolk's price level (8% below national, BEA RPP 91.5), that paycheck buys what $133,633 would nationally. Nominal pay sits 6.9% below the Nebraska state average.
Based on BLS state-level estimates · View source
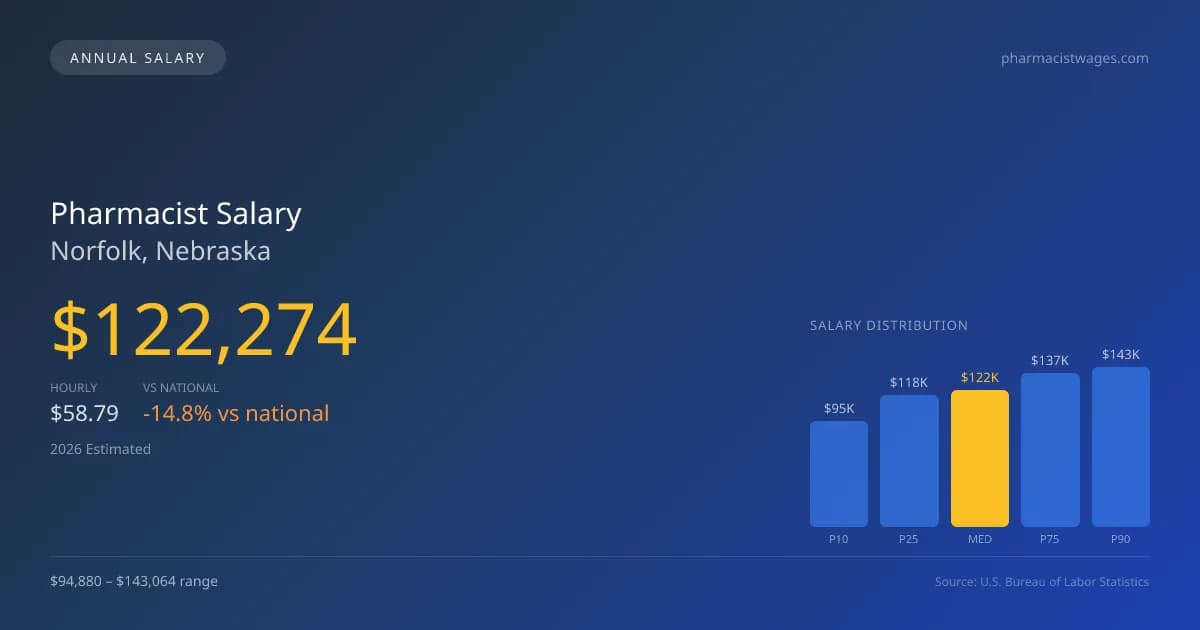
Pharmacists in Norfolk, NE, can anticipate a 2026 median annual salary of $122,274, a figure that reflects the unique landscape of healthcare roles in the area. The salary range spans from $94,880 at the lower decile to $143,064 for those who perform at the higher end, indicating the variance primarily influenced by the pharmacist's setting and specialization. Those in hospitals typically earn more than retail pharmacists, with clinical specialists and overnight retail positions also commanding higher wages as a result of the increased demand for specialized services and shift differentials. While the local salary is approximately 14.79% below the national median of $143,489, these figures derived from 2025 BLS data, projected to 2026, provide vital context for understanding pharmacist compensation in Norfolk's evolving market.
About the Norfolk Market
Salary estimated from Nebraska average ($130,000) adjusted for local cost of living.
Salary Breakdown
| Percentile | Annual | Hourly |
|---|---|---|
| Entry Level (P10) | $94,880 | $45.62 |
| Lower Range (P25) | $117,583 | $56.53 |
| Median (P50)(typical) | $122,274 | $58.79 |
| Upper Range (P75) | $137,268 | $66.00 |
| Top Earners (P90) | $143,064 | $68.78 |
Median Salary Position
14.79% below the national average
2026 Salary Percentile Distribution in Norfolk
In Norfolk, NE, the pharmacist salary spread from the 10th to 90th percentile is $48,184 (2026 est.). At $122,274, the local median is 14.79% below the national median of $143,489.
Salary Calculator
At 40 hours/week in Norfolk: You'd be above the median
How Norfolk Pharmacist Pay Compares
Norfolk median: $122,274/year (2026)
| Compared To | Median Salary | Norfolk Pays |
|---|---|---|
| Nebraska Average | $131,337 | -6.90% less |
| National Average | $143,489 | -14.79% less |
Pharmacists in Norfolk, NE earn a median of $122,274 per year (2026 est.), which is 14.79% lower than the national median of $143,489 and 6.90% below the Nebraska state average of $131,337.
Cost-of-Living Adjusted Salary
Norfolk has a cost of living 8.50% below the national average, meaning your salary goes further here.
Adjusted salary = nominal × (100 / CoL index). CoL index: 100 = national average.
Norfolk, NE has a cost-of-living index of 91.5 (below the national average of 100). A pharmacist earning $122,274 nominally has purchasing power equivalent to $133,633 in an average-cost city — an effective 9.29% boost.
Compare Purchasing Power
Select a city to see how your salary compares after cost of living
Select a city above to compare purchasing power
2019 BLS Actual
$109,152
2025 BLS Actual
$120,077
2026 Current Est.
$122,274
2019–2027 Growth
+14.1%
Salary Trajectory for Pharmacists in Norfolk (2019–2027)
2019–2025: actual BLS OEWS data for this metro area. 2026+: CAGR 1.83% projection.
| Year | Annual Salary | Status |
|---|---|---|
| 2019 | $109,152 | Actual |
| 2020 | $109,681 | Actual |
| 2021 | $109,561 | Actual |
| 2022 | $113,123 | Actual |
| 2023 | $115,918 | Actual |
| 2024 | $110,780 | Actual |
| 2025 | $120,077 | Actual |
| 2026(current) | $122,274 | Estimated |
| 2027 | $124,512 | Projected |
Based on 7 years of BLS OEWS data for the Norfolk metropolitan area, the median pharmacist salary grew 10.0% from $109,152 (2019) to $120,077 (2025). At a 1.83% compound annual growth rate, salaries are projected to reach $124,512 by 2027 — a total increase of $15,360 (14.07%) from 2019.
Note: Historical values (2019–2025) are actual BLS OEWS figures for the Norfolk metropolitan area, sourced from annual Occupational Employment and Wage Statistics surveys. 2026–2026 figures are current estimates, and 2027 values are projections, calculated using a 1.83% CAGR derived from 7-year BLS historical data. Actual salaries may vary based on employer, experience, certifications, and local market conditions.
Salary by Experience Level
| Experience | Estimated Salary Range |
|---|---|
| 0-2 years (New Graduate) | $94,880 – $117,583 |
| 3-5 years (Mid Career) | $117,583 – $122,274 |
| 5+ years (Experienced) | $122,274 – $137,268 |
| 10+ years (Top Earner) | $137,268 – $143,064 |
PharmD salary ranges estimated from BLS percentile data. Individual pharmacist compensation varies by employer, certifications, and specialization.
Pharmacist Job Market in Norfolk
The local job landscape consists of just six pharmacists, which can create both opportunities and challenges for professionals entering the field. With a cost-of-living index at 91.5, the effective purchasing power of salaries is more favorable than in many larger markets, yet competitors must remain strategic. Retail pharmacy chains, particularly CVS and Walgreens, might present some of the lower-end salaries, while hospital and specialty pharmacies generally compensate at higher rates. Factors contributing to the pay range include specialization, board certification stipends, and potential residency training—considerations increasingly critical as the industry shifts focus toward more specialized care settings. As retail chains consolidate and close locations, there may be a growing need for skilled pharmacists in hospitals and specialty areas, making targeted applications in these sectors key for maximizing overall earnings in Norfolk, NE.
More salary data for Norfolk, NE:
Frequently Asked Questions
How much do pharmacists make in Norfolk, NE in 2026?
Is Norfolk, NE a good place to work as a pharmacist?
Can pharmacists make $100K in Norfolk?
What is the cost-of-living adjusted pharmacist salary in Norfolk?
How much does a pharmacist make per hour in Norfolk?
Related Pages
Compare Salaries
Career Resources
Nearby Cities in Nebraska
Written by Sofia Chen, PharmD
Career Analyst
Sofia Chen has 10 years of experience in community pharmacy. She specializes in medication therapy management.
Methodology & Data Source
Salary figures on this page are 2026 projections based on the Bureau of Labor Statistics Occupational Employment and Wage Statistics (OEWS) survey, May 2026 release. The BLS reported a median annual salary of $120,077 for pharmacistsin the Norfolk metropolitan area. A 1.83% compound annual growth rate (CAGR), calculated from 6-year national BLS wage trends, was applied to project current 2026 compensation. Percentile ranges (P10–P90) represent the full salary distribution across experience levels and practice settings in this market.
Data Sources & Methodology
Salary data for Norfolk is estimated from official BLS state-level occupational wage data (2025), adjusted for regional cost-of-living differences using BEA RPP (Regional Price Parities).
2026 figures are projected from 2025 BLS data using a compound annual growth rate (CAGR) of 1.83%, derived from historical BLS wage trends for pharmacists (SOC 29-1051).
Compiled and verified by Sofia Chen, PharmD, a licensed pharmacist with 10+ years of clinical experience. · View source data at BLS.gov