Pharmacist Salary in Nevada: $142,583 (2026)
Quick Answer:Across Nevada's 9 metropolitan areas, the average median pharmacist pay sits at $142,583/year heading into 2026 — a figure projected from 2025 BLS OEWS wage data for SOC 29-1051. Because Nevada sits at BEA RPP 98.3 (2% below the U.S. baseline), that statewide median translates to roughly $145,049 in nationally-comparable purchasing power. Highest-paying metros: Carson City ($163,990), Reno ($154,380), Sparks ($139,749).
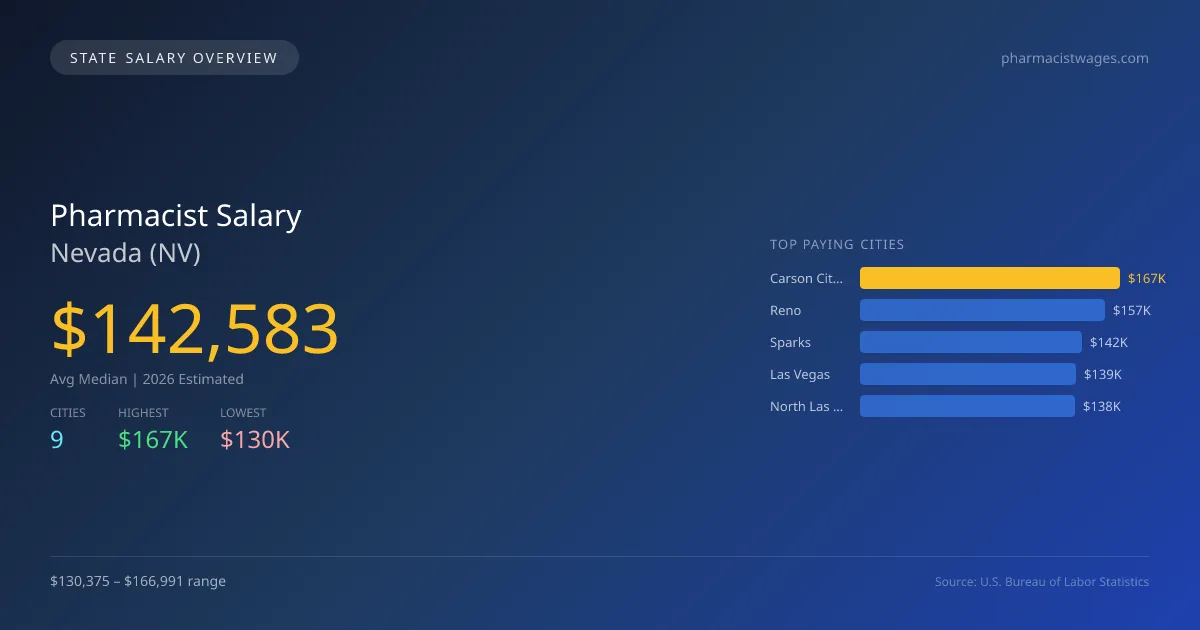
In 2026, the average median salary for pharmacists in Nevada is projected to be $142,583, which is slightly below the national median of $143,489, marking a -0.6% difference. There is a notable salary disparity among cities; Carson City offers the highest salary at $166,991, while Fernley provides the lowest at $130,375, resulting in a gap of $36,616. This variance can be attributed to factors such as demand for healthcare services, local cost of living, and the presence of healthcare facilities. Nevada's specific regulatory landscape impacts pharmacist practice. State licensing requirements are in place, and scope of practice laws can vary in complexity. Pharmacists are increasingly involved in patient care processes, reflecting a growing demand for their expertise in various healthcare settings. The overall job market for pharmacists is stable, with an annual growth rate of 1.83%, indicating a gradual increase in opportunities from 2025 data. Key metro areas for pharmacist employment include Carson City, Reno at $157,205, Sparks at $142,306, Las Vegas at $138,743, and North Las Vegas at $138,161. Understanding these salary figures and market conditions will aid those considering a pharmacy career in Nevada.
Nevada Pharmacist Salary Range
Overall salary range in Nevada: $92,995 (lowest entry-level) to $182,669 (highest top earner)
Nevada vs National Average
Nevada pharmacists earn 0.63% less than the national median ($-906/year difference).
Nevada Pharmacist Salary Distribution (2026)
Pharmacist salaries in Nevada range from $110,229 (entry-level, 10th percentile) to $171,778 (top earners, 90th percentile), with a median of $142,583. The Nevada median is $906 below the US national median of $143,489. The average hourly rate is $68.55/hr. Approximately 2,521 pharmacists are employed across 9 cities.
2019 BLS Actual
$127,896
2025 BLS Actual
$140,021
2026 Current Est.
$142,583
2019–2027 Growth
+13.5%
Salary Trajectory for Pharmacists in Nevada (2019–2027)
2019–2025: actual BLS OEWS data for this metro area. 2026+: CAGR 1.83% projection.
| Year | Annual Salary | Status |
|---|---|---|
| 2019 | $127,896 | Actual |
| 2020 | $128,769 | Actual |
| 2021 | $128,608 | Actual |
| 2022 | $131,390 | Actual |
| 2023 | $134,440 | Actual |
| 2024 | $138,847 | Actual |
| 2025 | $140,021 | Actual |
| 2026(current) | $142,583 | Estimated |
| 2027 | $145,192 | Projected |
Based on 7 years of BLS OEWS data for the Nevada metropolitan area, the median pharmacist salary grew 9.5% from $127,896 (2019) to $140,021 (2025). At a 1.83% compound annual growth rate, salaries are projected to reach $145,192 by 2027 — a total increase of $17,296 (13.52%) from 2019.
Note: Historical values (2019–2025) are actual BLS OEWS figures for the Nevada metropolitan area, sourced from annual Occupational Employment and Wage Statistics surveys. 2026–2026 figures are current estimates, and 2027 values are projections, calculated using a 1.83% CAGR derived from 7-year BLS historical data. Actual salaries may vary based on employer, experience, certifications, and local market conditions.
Top 5 Highest Paying Cities in Nevada
Lowest Paying Cities in Nevada
| City | Median Salary |
|---|---|
| Fernley | $130,375 |
| Elko | $131,977 |
| Mesquite | $132,645 |
| Henderson | $137,450 |
| North Las Vegas | $138,161 |
Best Value Cities for Pharmacists in Nevada
When adjusted for local cost of living, these Nevada cities offer the most purchasing power for pharmacists.
| City | Nominal Salary | CoL Index | Adjusted Salary |
|---|---|---|---|
| Carson City | $166,991 | 98.13 | $170,173 |
| Reno | $157,205 | 101.014 | $155,627 |
| Sparks | $142,306 | 98.3 | $144,767 |
| North Las Vegas | $138,161 | 98.3 | $140,550 |
| Henderson | $137,450 | 98.3 | $139,827 |
Adjusted salary = nominal salary × (100 / CoL index). CoL index: 100 = national average. Lower index = lower cost of living.
Salary by Experience Level in Nevada
| Experience Level | Estimated Annual |
|---|---|
| Entry Level (0-2 years) | $110,229 |
| Mid Career (3-7 years) | $142,583 |
| Experienced (7+ years) | $171,778 |
Estimates based on BLS percentile data averaged across Nevada metro areas. Individual pay varies by employer, certifications, and specialization.
All 9 Cities in Nevada
| # | City | Median Salary |
|---|---|---|
| 1 | Carson City | $166,991 |
| 2 | Reno | $157,205 |
| 3 | Sparks | $142,306 |
| 4 | Las Vegas | $138,743 |
| 5 | North Las Vegas | $138,161 |
| 6 | Henderson | $137,450 |
| 7 | Mesquite | $132,645 |
| 8 | Elko | $131,977 |
| 9 | Fernley | $130,375 |
More Nevada Salary Data
Explore More Pharmacist Salary Data
Frequently Asked Questions
How much do pharmacists make in Nevada in 2026?
What is the highest paying city for pharmacists in Nevada?
How does Nevada pharmacist pay compare to the national average?
What is the entry-level pharmacist salary in Nevada?
How many pharmacists are employed in Nevada?
Which Nevada city offers the best value for pharmacists?
Written by Sofia Chen, PharmD
Career Analyst
Sofia Chen has 10 years of experience in community pharmacy. She specializes in medication therapy management.
Methodology & Data Source
Statewide salary figures on this page are 2026 projections based on the Bureau of Labor Statistics Occupational Employment and Wage Statistics (OEWS) survey, May 2026 release. A 1.83% compound annual growth rate (CAGR), derived from 6-year national BLS wage trends, was applied to each metro area's reported salary to estimate current 2026 pharmacist compensation across Nevada. State averages are employment-weighted across 9 metro areas — larger metro areas with more pharmacistscontribute proportionally more to the average, producing figures that better reflect typical compensation. Individual pay varies by city, employer, certifications, and experience.
Data Sources & Methodology
Source: BLS, OEWS, 7-year dataset (–). Per-city data from annual BLS metropolitan area surveys.
2026 figures are projected from 2025 BLS data using a compound annual growth rate (CAGR) of 1.83%, derived from historical BLS wage trends for pharmacists (SOC 29-1051).
Compiled and verified by Sofia Chen, PharmD, a licensed pharmacist with 10+ years of clinical experience. · View source data at BLS.gov