Pharmacist Salary in Oregon: $169,291 (2026)
Quick Answer:Across Oregon's 36 metropolitan areas, the average median pharmacist pay sits at $169,291/year heading into 2026 — a figure projected from 2025 BLS OEWS wage data for SOC 29-1051. Because Oregon sits at BEA RPP 102.6 (3% above the U.S. baseline), that statewide median translates to roughly $165,001 in nationally-comparable purchasing power. Highest-paying metros: Hillsboro ($172,673), Corvallis ($170,470), Salem ($169,210).
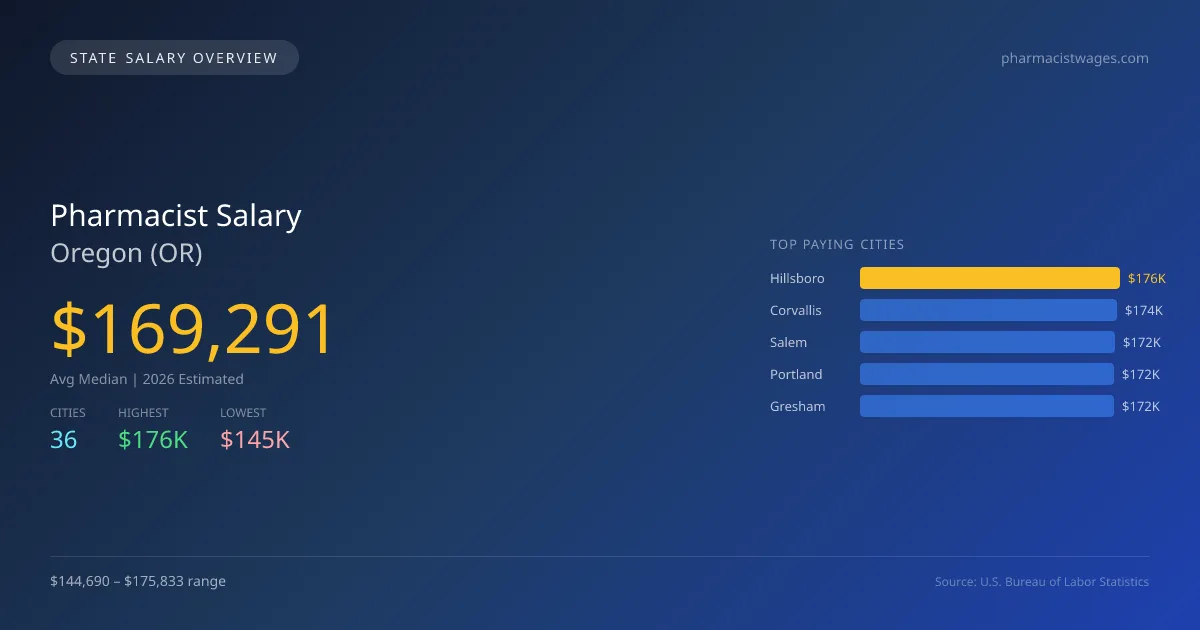
For those considering a career in pharmacy in Oregon, the projected average median salary for 2026 is $169,291, surpassing the national median of $143,489 by 18.0%. The salary spectrum varies significantly across the state, with Hillsboro leading at $175,833, while Grants Pass offers the lowest at $144,690. This $31,143 gap may be influenced by factors such as cost of living, local demand for pharmacists, and healthcare infrastructure in different regions. Oregon has specific licensing requirements and practice scope laws, allowing pharmacists to perform a range of clinical services. This broader scope can enhance job satisfaction and potentially influence salary levels. The demand for pharmacists in Oregon is on a steady growth path, with a 1.83% annual Compound Annual Growth Rate (CAGR) projected from 2025 data, indicating a stable job market. The top cities for pharmacist salaries in Oregon in 2026 are Hillsboro ($175,833), Corvallis ($173,590), Salem ($172,307), Portland ($171,920), and Gresham ($171,659). Overall, the state presents a positive outlook for aspiring pharmacists, combining competitive salaries with increasing employment opportunities.
Oregon Pharmacist Salary Range
Overall salary range in Oregon: $95,099 (lowest entry-level) to $216,322 (highest top earner)
Oregon vs National Average
Oregon pharmacists earn 17.98% more than the national median (+$25,802/year difference).
Oregon Pharmacist Salary Distribution (2026)
Pharmacist salaries in Oregon range from $128,810 (entry-level, 10th percentile) to $195,359 (top earners, 90th percentile), with a median of $169,291. The Oregon median is $25,802 above the US national median of $143,489. The average hourly rate is $81.39/hr. Approximately 3,444 pharmacists are employed across 36 cities.
2019 BLS Actual
$141,742
2025 BLS Actual
$166,249
2026 Current Est.
$169,291
2019–2027 Growth
+21.6%
Salary Trajectory for Pharmacists in Oregon (2019–2027)
2019–2025: actual BLS OEWS data for this metro area. 2026+: CAGR 1.83% projection.
| Year | Annual Salary | Status |
|---|---|---|
| 2019 | $141,742 | Actual |
| 2020 | $142,308 | Actual |
| 2021 | $133,601 | Actual |
| 2022 | $143,923 | Actual |
| 2023 | $153,509 | Actual |
| 2024 | $163,779 | Actual |
| 2025 | $166,249 | Actual |
| 2026(current) | $169,291 | Estimated |
| 2027 | $172,389 | Projected |
Based on 7 years of BLS OEWS data for the Oregon metropolitan area, the median pharmacist salary grew 17.3% from $141,742 (2019) to $166,249 (2025). At a 1.83% compound annual growth rate, salaries are projected to reach $172,389 by 2027 — a total increase of $30,647 (21.62%) from 2019.
Note: Historical values (2019–2025) are actual BLS OEWS figures for the Oregon metropolitan area, sourced from annual Occupational Employment and Wage Statistics surveys. 2026–2026 figures are current estimates, and 2027 values are projections, calculated using a 1.83% CAGR derived from 7-year BLS historical data. Actual salaries may vary based on employer, experience, certifications, and local market conditions.
Top 5 Highest Paying Cities in Oregon
Lowest Paying Cities in Oregon
| City | Median Salary |
|---|---|
| Grants Pass | $144,690 |
| Milwaukie | $154,186 |
| Klamath Falls | $154,551 |
| The Dalles | $155,485 |
| Springfield | $156,692 |
Best Value Cities for Pharmacists in Oregon
When adjusted for local cost of living, these Oregon cities offer the most purchasing power for pharmacists.
| City | Nominal Salary | CoL Index | Adjusted Salary |
|---|---|---|---|
| Hillsboro | $175,833 | 102.6 | $171,377 |
| Gresham | $171,659 | 102.6 | $167,309 |
| Corvallis | $173,590 | 104.017 | $166,886 |
| Salem | $172,307 | 103.649 | $166,241 |
| Medford | $166,533 | 101.433 | $164,180 |
Adjusted salary = nominal salary × (100 / CoL index). CoL index: 100 = national average. Lower index = lower cost of living.
Salary by Experience Level in Oregon
| Experience Level | Estimated Annual |
|---|---|
| Entry Level (0-2 years) | $128,810 |
| Mid Career (3-7 years) | $169,291 |
| Experienced (7+ years) | $195,359 |
Estimates based on BLS percentile data averaged across Oregon metro areas. Individual pay varies by employer, certifications, and specialization.
All 36 Cities in Oregon
| # | City | Median Salary |
|---|---|---|
| 1 | Hillsboro | $175,833 |
| 2 | Corvallis | $173,590 |
| 3 | Salem | $172,307 |
| 4 | Portland | $171,920 |
| 5 | Gresham | $171,659 |
| 6 | Bend | $168,997 |
| 7 | Beaverton | $166,771 |
| 8 | Medford | $166,533 |
| 9 | McMinnville | $166,319 |
| 10 | Oregon City | $166,123 |
| 11 | Woodburn | $165,017 |
| 12 | Lake Oswego | $164,222 |
| 13 | Forest Grove | $163,793 |
| 14 | Tigard | $163,104 |
| 15 | Redmond | $163,051 |
| 16 | West Linn | $162,582 |
| 17 | Tualatin | $161,177 |
| 18 | Pendleton | $161,162 |
| 19 | Wilsonville | $160,929 |
| 20 | Albany | $160,891 |
| 21 | Happy Valley | $159,547 |
| 22 | Hermiston | $159,105 |
| 23 | Central Point | $159,030 |
| 24 | Ashland | $159,018 |
| 25 | Keizer | $158,976 |
| 26 | Sherwood | $158,967 |
| 27 | Eugene | $158,743 |
| 28 | Coos Bay | $158,702 |
| 29 | Roseburg | $158,122 |
| 30 | Canby | $158,033 |
| 31 | Newberg | $157,162 |
| 32 | Springfield | $156,692 |
| 33 | The Dalles | $155,485 |
| 34 | Klamath Falls | $154,551 |
| 35 | Milwaukie | $154,186 |
| 36 | Grants Pass | $144,690 |
More Oregon Salary Data
Explore More Pharmacist Salary Data
Frequently Asked Questions
How much do pharmacists make in Oregon in 2026?
What is the highest paying city for pharmacists in Oregon?
How does Oregon pharmacist pay compare to the national average?
What is the entry-level pharmacist salary in Oregon?
How many pharmacists are employed in Oregon?
Which Oregon city offers the best value for pharmacists?
Written by Sofia Chen, PharmD
Career Analyst
Sofia Chen has 10 years of experience in community pharmacy. She specializes in medication therapy management.
Methodology & Data Source
Statewide salary figures on this page are 2026 projections based on the Bureau of Labor Statistics Occupational Employment and Wage Statistics (OEWS) survey, May 2026 release. A 1.83% compound annual growth rate (CAGR), derived from 6-year national BLS wage trends, was applied to each metro area's reported salary to estimate current 2026 pharmacist compensation across Oregon. State averages are employment-weighted across 36 metro areas — larger metro areas with more pharmacistscontribute proportionally more to the average, producing figures that better reflect typical compensation. Individual pay varies by city, employer, certifications, and experience.
Data Sources & Methodology
Source: BLS, OEWS, 7-year dataset (–). Per-city data from annual BLS metropolitan area surveys.
2026 figures are projected from 2025 BLS data using a compound annual growth rate (CAGR) of 1.83%, derived from historical BLS wage trends for pharmacists (SOC 29-1051).
Compiled and verified by Sofia Chen, PharmD, a licensed pharmacist with 10+ years of clinical experience. · View source data at BLS.gov