Pharmacist Salary in Vermont: $156,078 (2026)
Quick Answer:Across Vermont's 9 metropolitan areas, the average median pharmacist pay sits at $156,078/year heading into 2026 — a figure projected from 2025 BLS OEWS wage data for SOC 29-1051. Because Vermont sits at BEA RPP 103.5 (4% above the U.S. baseline), that statewide median translates to roughly $150,800 in nationally-comparable purchasing power. Highest-paying metros: South Burlington ($156,330), Burlington ($155,540), Bennington ($139,751).
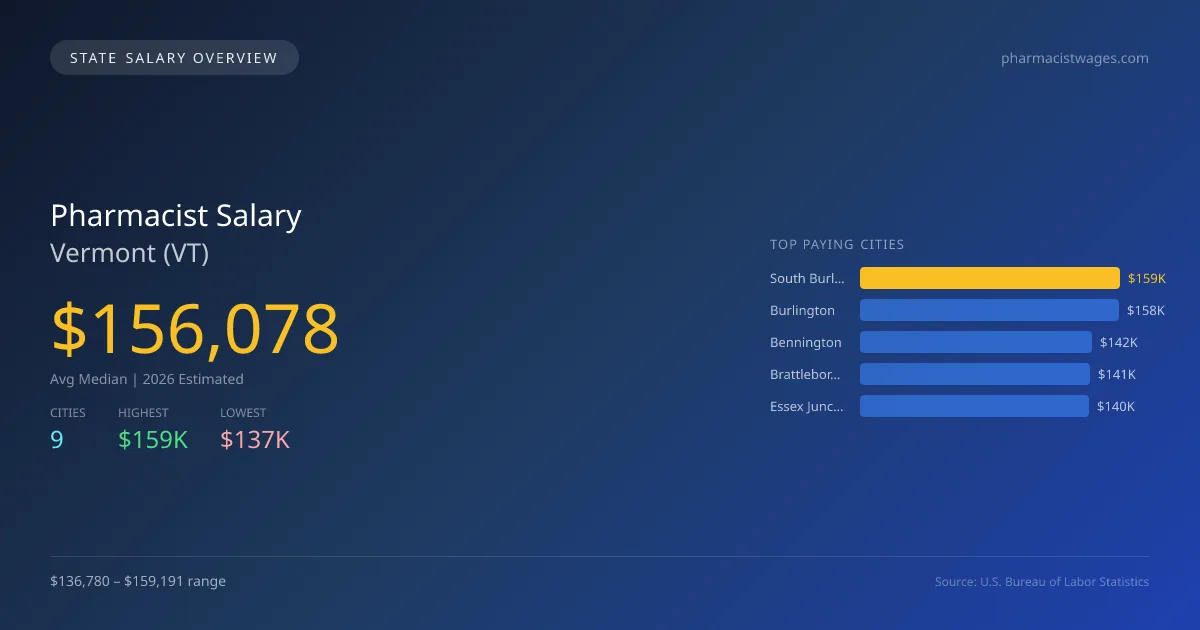
In Vermont, the projected average median salary for pharmacists in 2026 is $156,078, which is 8.8% higher than the national median of $143,489. This indicates a favorable salary environment for pharmacists in the state. The highest paying city is South Burlington, with a salary of $159,191, while Montpelier offers the lowest at $136,780, creating a salary gap of $22,411. Factors driving this difference include local demand for healthcare services, cost of living variations, and the availability of pharmacy positions in urban versus rural areas. Vermont requires pharmacists to hold a state license, which involves passing both national and state exams. The state's scope of practice laws further allow pharmacists to participate in medication therapy management and other clinical services, which enhances their role in healthcare. As for the job market, there are currently 290 pharmacists employed in Vermont, and the projected annual growth rate is 1.83%, indicating a steady demand for pharmacists in the coming years. Other cities with competitive salaries include Burlington at $158,386, Bennington at $142,308, Brattleboro at $140,701, and Essex Junction at $140,399, reflecting a solid employment outlook across the state.
Vermont Pharmacist Salary Range
Overall salary range in Vermont: $100,720 (lowest entry-level) to $190,542 (highest top earner)
Vermont vs National Average
Vermont pharmacists earn 8.77% more than the national median (+$12,589/year difference).
Vermont Pharmacist Salary Distribution (2026)
Pharmacist salaries in Vermont range from $125,062 (entry-level, 10th percentile) to $165,735 (top earners, 90th percentile), with a median of $156,078. The Vermont median is $12,589 above the US national median of $143,489. The average hourly rate is $75.04/hr. Approximately 290 pharmacists are employed across 9 cities.
2019 BLS Actual
$147,320
2025 BLS Actual
$153,273
2026 Current Est.
$156,078
2019–2027 Growth
+7.9%
Salary Trajectory for Pharmacists in Vermont (2019–2027)
2019–2025: actual BLS OEWS data for this metro area. 2026+: CAGR 1.83% projection.
| Year | Annual Salary | Status |
|---|---|---|
| 2019 | $147,320 | Actual |
| 2020 | $139,080 | Actual |
| 2021 | $130,870 | Actual |
| 2022 | $134,610 | Actual |
| 2023 | $141,130 | Actual |
| 2024 | $143,415 | Actual |
| 2025 | $153,273 | Actual |
| 2026(current) | $156,078 | Estimated |
| 2027 | $158,934 | Projected |
Based on 7 years of BLS OEWS data for the Vermont metropolitan area, the median pharmacist salary grew 4.0% from $147,320 (2019) to $153,273 (2025). At a 1.83% compound annual growth rate, salaries are projected to reach $158,934 by 2027 — a total increase of $11,614 (7.88%) from 2019.
Note: Historical values (2019–2025) are actual BLS OEWS figures for the Vermont metropolitan area, sourced from annual Occupational Employment and Wage Statistics surveys. 2026–2026 figures are current estimates, and 2027 values are projections, calculated using a 1.83% CAGR derived from 7-year BLS historical data. Actual salaries may vary based on employer, experience, certifications, and local market conditions.
Top 5 Highest Paying Cities in Vermont
Lowest Paying Cities in Vermont
| City | Median Salary |
|---|---|
| Montpelier | $136,780 |
| Colchester | $137,473 |
| Rutland | $137,629 |
| Barre | $140,209 |
| Essex Junction | $140,399 |
Best Value Cities for Pharmacists in Vermont
When adjusted for local cost of living, these Vermont cities offer the most purchasing power for pharmacists.
| City | Nominal Salary | CoL Index | Adjusted Salary |
|---|---|---|---|
| Burlington | $158,386 | 100.949 | $156,897 |
| South Burlington | $159,191 | 103.5 | $153,808 |
| Bennington | $142,308 | 103.5 | $137,496 |
| Brattleboro | $140,701 | 103.5 | $135,943 |
| Essex Junction | $140,399 | 103.5 | $135,651 |
Adjusted salary = nominal salary × (100 / CoL index). CoL index: 100 = national average. Lower index = lower cost of living.
Salary by Experience Level in Vermont
| Experience Level | Estimated Annual |
|---|---|
| Entry Level (0-2 years) | $125,062 |
| Mid Career (3-7 years) | $156,078 |
| Experienced (7+ years) | $165,735 |
Estimates based on BLS percentile data averaged across Vermont metro areas. Individual pay varies by employer, certifications, and specialization.
All 9 Cities in Vermont
| # | City | Median Salary |
|---|---|---|
| 1 | South Burlington | $159,191 |
| 2 | Burlington | $158,386 |
| 3 | Bennington | $142,308 |
| 4 | Brattleboro | $140,701 |
| 5 | Essex Junction | $140,399 |
| 6 | Barre | $140,209 |
| 7 | Rutland | $137,629 |
| 8 | Colchester | $137,473 |
| 9 | Montpelier | $136,780 |
More Vermont Salary Data
Hourly Rates
Explore pharmacist hourly pay in Vermont cities.
Senior / Experienced
Top earner salaries for experienced pharmacists.
Explore More Pharmacist Salary Data
Frequently Asked Questions
How much do pharmacists make in Vermont in 2026?
What is the highest paying city for pharmacists in Vermont?
How does Vermont pharmacist pay compare to the national average?
What is the entry-level pharmacist salary in Vermont?
How many pharmacists are employed in Vermont?
Which Vermont city offers the best value for pharmacists?
Written by Sofia Chen, PharmD
Career Analyst
Sofia Chen has 10 years of experience in community pharmacy. She specializes in medication therapy management.
Methodology & Data Source
Statewide salary figures on this page are 2026 projections based on the Bureau of Labor Statistics Occupational Employment and Wage Statistics (OEWS) survey, May 2026 release. A 1.83% compound annual growth rate (CAGR), derived from 6-year national BLS wage trends, was applied to each metro area's reported salary to estimate current 2026 pharmacist compensation across Vermont. State averages are employment-weighted across 9 metro areas — larger metro areas with more pharmacistscontribute proportionally more to the average, producing figures that better reflect typical compensation. Individual pay varies by city, employer, certifications, and experience.
Data Sources & Methodology
Source: BLS, OEWS, 7-year dataset (–). Per-city data from annual BLS metropolitan area surveys.
2026 figures are projected from 2025 BLS data using a compound annual growth rate (CAGR) of 1.83%, derived from historical BLS wage trends for pharmacists (SOC 29-1051).
Compiled and verified by Sofia Chen, PharmD, a licensed pharmacist with 10+ years of clinical experience. · View source data at BLS.gov