Pharmacist Salary in Illinois: $142,852 (2026)
Quick Answer:Across Illinois's 65 metropolitan areas, the average median pharmacist pay sits at $142,852/year heading into 2026 — a figure projected from 2025 BLS OEWS wage data for SOC 29-1051. Because Illinois sits at BEA RPP 97.1 (3% below the U.S. baseline), that statewide median translates to roughly $147,118 in nationally-comparable purchasing power. Highest-paying metros: Decatur ($145,960), Moline ($143,041), Naperville ($142,351).
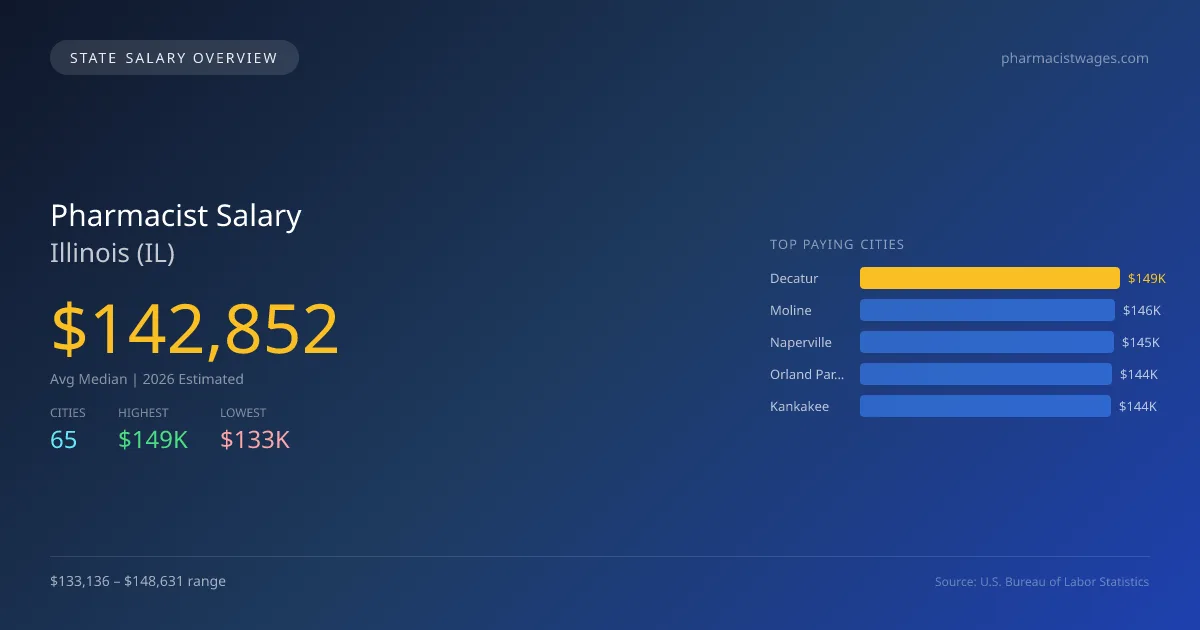
For those considering a pharmacy career in Illinois, the projected average median salary for 2026 is $142,851, which is slightly below the national median of $143,489, representing a difference of -0.4%. The highest paying city is Decatur at $148,631, while Carbondale offers the lowest salary at $133,136, indicating a significant salary gap of $15,495. Factors contributing to this disparity include the cost of living, demand for pharmacists in various regions, and the type of employment settings. In Illinois, pharmacists must meet state licensing requirements, including completing an accredited pharmacy program and passing national as well as state exams. The scope of practice laws in Illinois allow for advanced roles, which can influence salary levels based on the responsibilities undertaken. The job market shows promise with an annual compound growth rate (CAGR) of 1.83%, indicating steady demand for pharmacists overall. Top earning cities in 2026 include Decatur at $148,631, followed by Moline at $145,659, Naperville at $144,956, Orland Park at $144,123, and Kankakee at $143,540. Understanding these dynamics will be essential for professionals navigating their careers in the Illinois pharmacy landscape.
Illinois Pharmacist Salary Range
Overall salary range in Illinois: $86,505 (lowest entry-level) to $189,477 (highest top earner)
Illinois vs National Average
Illinois pharmacists earn 0.44% less than the national median ($-637/year difference).
Illinois Pharmacist Salary Distribution (2026)
Pharmacist salaries in Illinois range from $89,784 (entry-level, 10th percentile) to $174,294 (top earners, 90th percentile), with a median of $142,852. The Illinois median is $637 below the US national median of $143,489. The average hourly rate is $68.68/hr. Approximately 10,991 pharmacists are employed across 65 cities.
2019 BLS Actual
$130,214
2025 BLS Actual
$140,284
2026 Current Est.
$142,852
2019–2027 Growth
+11.7%
Salary Trajectory for Pharmacists in Illinois (2019–2027)
2019–2025: actual BLS OEWS data for this metro area. 2026+: CAGR 1.83% projection.
| Year | Annual Salary | Status |
|---|---|---|
| 2019 | $130,214 | Actual |
| 2020 | $131,521 | Actual |
| 2021 | $127,941 | Actual |
| 2022 | $131,929 | Actual |
| 2023 | $136,045 | Actual |
| 2024 | $136,833 | Actual |
| 2025 | $140,284 | Actual |
| 2026(current) | $142,852 | Estimated |
| 2027 | $145,466 | Projected |
Based on 7 years of BLS OEWS data for the Illinois metropolitan area, the median pharmacist salary grew 7.7% from $130,214 (2019) to $140,284 (2025). At a 1.83% compound annual growth rate, salaries are projected to reach $145,466 by 2027 — a total increase of $15,252 (11.71%) from 2019.
Note: Historical values (2019–2025) are actual BLS OEWS figures for the Illinois metropolitan area, sourced from annual Occupational Employment and Wage Statistics surveys. 2026–2026 figures are current estimates, and 2027 values are projections, calculated using a 1.83% CAGR derived from 7-year BLS historical data. Actual salaries may vary based on employer, experience, certifications, and local market conditions.
Top 5 Highest Paying Cities in Illinois
Lowest Paying Cities in Illinois
| City | Median Salary |
|---|---|
| Carbondale | $133,136 |
| Elmhurst | $134,461 |
| Calumet City | $134,792 |
| Galesburg | $134,836 |
| Crystal Lake | $135,354 |
Best Value Cities for Pharmacists in Illinois
When adjusted for local cost of living, these Illinois cities offer the most purchasing power for pharmacists.
| City | Nominal Salary | CoL Index | Adjusted Salary |
|---|---|---|---|
| Decatur | $148,631 | 88.422 | $168,093 |
| Peoria | $142,460 | 91.231 | $156,153 |
| Champaign | $141,819 | 92.704 | $152,980 |
| Bloomington | $141,595 | 93.537 | $151,379 |
| Moline | $145,659 | 97.1 | $150,009 |
Adjusted salary = nominal salary × (100 / CoL index). CoL index: 100 = national average. Lower index = lower cost of living.
Salary by Experience Level in Illinois
| Experience Level | Estimated Annual |
|---|---|
| Entry Level (0-2 years) | $89,784 |
| Mid Career (3-7 years) | $142,852 |
| Experienced (7+ years) | $174,294 |
Estimates based on BLS percentile data averaged across Illinois metro areas. Individual pay varies by employer, certifications, and specialization.
All 65 Cities in Illinois
| # | City | Median Salary |
|---|---|---|
| 1 | Decatur | $148,631 |
| 2 | Moline | $145,659 |
| 3 | Naperville | $144,956 |
| 4 | Orland Park | $144,123 |
| 5 | Kankakee | $143,540 |
| 6 | Bolingbrook | $143,504 |
| 7 | Chicago | $143,458 |
| 8 | Rock Island | $143,402 |
| 9 | Peoria | $142,460 |
| 10 | Palatine | $142,424 |
| 11 | Waukegan | $142,345 |
| 12 | Elgin | $142,178 |
| 13 | Mount Prospect | $142,074 |
| 14 | Champaign | $141,819 |
| 15 | Hoffman Estates | $141,613 |
| 16 | Bloomington | $141,595 |
| 17 | Evanston | $141,343 |
| 18 | Urbana | $141,302 |
| 19 | Joliet | $141,224 |
| 20 | Oak Park | $141,107 |
| 21 | Danville | $140,815 |
| 22 | Addison | $140,517 |
| 23 | Berwyn | $140,453 |
| 24 | Aurora | $140,362 |
| 25 | Tinley Park | $140,341 |
| 26 | Northbrook | $140,198 |
| 27 | St. Charles | $140,109 |
| 28 | Gurnee | $140,075 |
| 29 | Arlington Heights | $139,880 |
| 30 | Wheaton | $139,700 |
| 31 | Woodridge | $139,657 |
| 32 | Schaumburg | $139,587 |
| 33 | Buffalo Grove | $139,546 |
| 34 | Bartlett | $139,536 |
| 35 | Lake in the Hills | $139,017 |
| 36 | Collinsville | $138,995 |
| 37 | Skokie | $138,956 |
| 38 | Wheeling | $138,753 |
| 39 | Carpentersville | $138,598 |
| 40 | Oak Lawn | $138,506 |
| 41 | O'Fallon | $138,477 |
| 42 | Quincy | $137,936 |
| 43 | Algonquin | $137,936 |
| 44 | Springfield | $137,919 |
| 45 | Carol Stream | $137,815 |
| 46 | Normal | $137,808 |
| 47 | Lombard | $137,726 |
| 48 | Cicero | $137,583 |
| 49 | Plainfield | $137,440 |
| 50 | Des Plaines | $137,413 |
| 51 | Oswego | $136,888 |
| 52 | DeKalb | $136,778 |
| 53 | Park Ridge | $136,667 |
| 54 | Rockford | $136,646 |
| 55 | Hanover Park | $136,612 |
| 56 | Glenview | $136,601 |
| 57 | Romeoville | $136,050 |
| 58 | Streamwood | $135,863 |
| 59 | Downers Grove | $135,609 |
| 60 | Belleville | $135,575 |
| 61 | Crystal Lake | $135,354 |
| 62 | Galesburg | $134,836 |
| 63 | Calumet City | $134,792 |
| 64 | Elmhurst | $134,461 |
| 65 | Carbondale | $133,136 |
More Illinois Salary Data
Compare Cities in Illinois
View all comparisons →Explore More Pharmacist Salary Data
Frequently Asked Questions
How much do pharmacists make in Illinois in 2026?
What is the highest paying city for pharmacists in Illinois?
How does Illinois pharmacist pay compare to the national average?
What is the entry-level pharmacist salary in Illinois?
How many pharmacists are employed in Illinois?
Which Illinois city offers the best value for pharmacists?
Written by Sofia Chen, PharmD
Career Analyst
Sofia Chen has 10 years of experience in community pharmacy. She specializes in medication therapy management.
Methodology & Data Source
Statewide salary figures on this page are 2026 projections based on the Bureau of Labor Statistics Occupational Employment and Wage Statistics (OEWS) survey, May 2026 release. A 1.83% compound annual growth rate (CAGR), derived from 6-year national BLS wage trends, was applied to each metro area's reported salary to estimate current 2026 pharmacist compensation across Illinois. State averages are employment-weighted across 65 metro areas — larger metro areas with more pharmacistscontribute proportionally more to the average, producing figures that better reflect typical compensation. Individual pay varies by city, employer, certifications, and experience.
Data Sources & Methodology
Source: BLS, OEWS, 7-year dataset (–). Per-city data from annual BLS metropolitan area surveys.
2026 figures are projected from 2025 BLS data using a compound annual growth rate (CAGR) of 1.83%, derived from historical BLS wage trends for pharmacists (SOC 29-1051).
Compiled and verified by Sofia Chen, PharmD, a licensed pharmacist with 10+ years of clinical experience. · View source data at BLS.gov