Pharmacist Salary in Danville, IL: $140,815 (2026)
Quick Answer:A full-time pharmacist in Danville, IL earns a median $140,815/year (≈ $67.70/hour) in nominal terms for 2026 — projected from BLS OEWS 2025 (SOC 29-1051). Once you factor in Danville's price level (3% below national, BEA RPP 97.1), that paycheck buys what $145,021 would nationally. Nominal pay sits 0.9% below the Illinois state average.
Based on BLS state-level estimates · View source
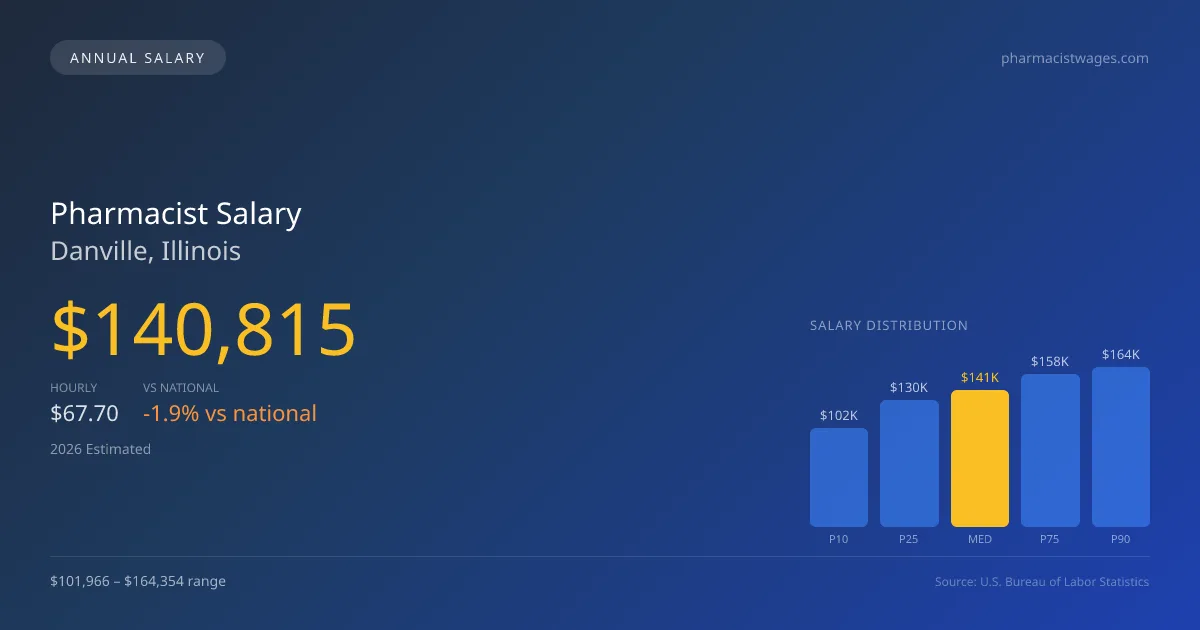
In 2026, pharmacists in Danville, Illinois, can expect a median annual salary of $140,815, which reflects a slight dip compared to the national median of $143,489. The salary range in this area spans from $101,966 at the 10th percentile to $164,354 at the 90th percentile, indicating a diverse market catering to varying levels of experience and specialization. These figures, based on 2025 BLS data projected to 2026, show how local economic conditions and regional price levels influence pharmacist compensation. Notably, those in hospital and specialty roles, particularly with residency training, tend to command higher salaries compared to their retail counterparts, reflecting the increasing demand for skilled pharmacists in advanced clinical settings in Danville.
About the Danville Market
Salary estimated from Illinois average ($132,000) adjusted for local cost of living.
Salary Breakdown
| Percentile | Annual | Hourly |
|---|---|---|
| Entry Level (P10) | $101,966 | $49.02 |
| Lower Range (P25) | $129,966 | $62.48 |
| Median (P50)(typical) | $140,815 | $67.70 |
| Upper Range (P75) | $157,562 | $75.75 |
| Top Earners (P90) | $164,354 | $79.02 |
Median Salary Position
1.86% below the national average
2026 Salary Percentile Distribution in Danville
In Danville, IL, the pharmacist salary spread from the 10th to 90th percentile is $62,388 (2026 est.). At $140,815, the local median is 1.86% below the national median of $143,489.
Salary Calculator
At 40 hours/week in Danville: You'd be above the median
How Danville Pharmacist Pay Compares
Danville median: $140,815/year (2026)
| Compared To | Median Salary | Danville Pays |
|---|---|---|
| Illinois Average | $142,093 | -0.90% less |
| National Average | $143,489 | -1.86% less |
Pharmacists in Danville, IL earn a median of $140,815 per year (2026 est.), which is 1.86% lower than the national median of $143,489 and 0.90% below the Illinois state average of $142,093.
Cost-of-Living Adjusted Salary
Danville has a cost of living 2.90% below the national average, meaning your salary goes further here.
Adjusted salary = nominal × (100 / CoL index). CoL index: 100 = national average.
Danville, IL has a cost-of-living index of 97.1 (below the national average of 100). A pharmacist earning $140,815 nominally has purchasing power equivalent to $145,021 in an average-cost city — an effective 2.99% boost.
Compare Purchasing Power
Select a city to see how your salary compares after cost of living
Select a city above to compare purchasing power
2019 BLS Actual
$129,540
2025 BLS Actual
$138,284
2026 Current Est.
$140,815
2019–2027 Growth
+10.7%
Salary Trajectory for Pharmacists in Danville (2019–2027)
2019–2025: actual BLS OEWS data for this metro area. 2026+: CAGR 1.83% projection.
| Year | Annual Salary | Status |
|---|---|---|
| 2019 | $129,540 | Actual |
| 2020 | $145,110 | Actual |
| 2021 | $124,740 | Actual |
| 2022 | $134,330 | Actual |
| 2023 | $130,510 | Actual |
| 2024 | $126,977 | Actual |
| 2025 | $138,284 | Actual |
| 2026(current) | $140,815 | Estimated |
| 2027 | $143,392 | Projected |
Based on 7 years of BLS OEWS data for the Danville metropolitan area, the median pharmacist salary grew 6.8% from $129,540 (2019) to $138,284 (2025). At a 1.83% compound annual growth rate, salaries are projected to reach $143,392 by 2027 — a total increase of $13,852 (10.69%) from 2019.
Note: Historical values (2019–2025) are actual BLS OEWS figures for the Danville metropolitan area, sourced from annual Occupational Employment and Wage Statistics surveys. 2026–2026 figures are current estimates, and 2027 values are projections, calculated using a 1.83% CAGR derived from 7-year BLS historical data. Actual salaries may vary based on employer, experience, certifications, and local market conditions.
Salary by Experience Level
| Experience | Estimated Salary Range |
|---|---|
| 0-2 years (New Graduate) | $101,966 – $129,966 |
| 3-5 years (Mid Career) | $129,966 – $140,815 |
| 5+ years (Experienced) | $140,815 – $157,562 |
| 10+ years (Top Earner) | $157,562 – $164,354 |
PharmD salary ranges estimated from BLS percentile data. Individual pharmacist compensation varies by employer, certifications, and specialization.
Pharmacist Job Market in Danville
Five pharmacists are currently employed in Danville, IL, a number that suggests a limited but specialized job market for this profession. The cost of living index for the area stands at 97.1, which is below the national average, thereby affecting the purchasing power of these salaries. Among local employers, hospital inpatient pharmacies and specialty pharmacies tend to offer the most lucrative positions, particularly for candidates holding board certifications from the BPS or those who have completed a PGY-1 residency. The variability in salaries can be attributed to factors such as work setting—clinical specialists often receive higher pay—and additional stipends for certifications and shift differentials. Retail chains are experiencing contraction, influencing job availability and compensation structures, making it essential for aspiring pharmacists in Danville to strategically pursue specialty roles or gain certifications that elevate their market value.
More salary data for Danville, IL:
Frequently Asked Questions
How much do pharmacists make in Danville, IL in 2026?
Is Danville, IL a good place to work as a pharmacist?
Can pharmacists make $100K in Danville?
What is the cost-of-living adjusted pharmacist salary in Danville?
How much does a pharmacist make per hour in Danville?
Related Pages
Compare Salaries
Career Resources
Nearby Cities in Illinois
Written by Sofia Chen, PharmD
Career Analyst
Sofia Chen has 10 years of experience in community pharmacy. She specializes in medication therapy management.
Methodology & Data Source
Salary figures on this page are 2026 projections based on the Bureau of Labor Statistics Occupational Employment and Wage Statistics (OEWS) survey, May 2026 release. The BLS reported a median annual salary of $138,284 for pharmacistsin the Danville metropolitan area. A 1.83% compound annual growth rate (CAGR), calculated from 6-year national BLS wage trends, was applied to project current 2026 compensation. Percentile ranges (P10–P90) represent the full salary distribution across experience levels and practice settings in this market.
Data Sources & Methodology
Salary data for Danville is estimated from official BLS state-level occupational wage data (2025), adjusted for regional cost-of-living differences using BEA RPP (Regional Price Parities).
2026 figures are projected from 2025 BLS data using a compound annual growth rate (CAGR) of 1.83%, derived from historical BLS wage trends for pharmacists (SOC 29-1051).
Compiled and verified by Sofia Chen, PharmD, a licensed pharmacist with 10+ years of clinical experience. · View source data at BLS.gov